Copyright © 2024 Swire Pacific Limited. All rights reserved.
Cookies and Privacy: We use cookies to enhance your user experience on our website. Please indicate your cookie preference. For more information, please read our Cookie Policy and Privacy Notice.
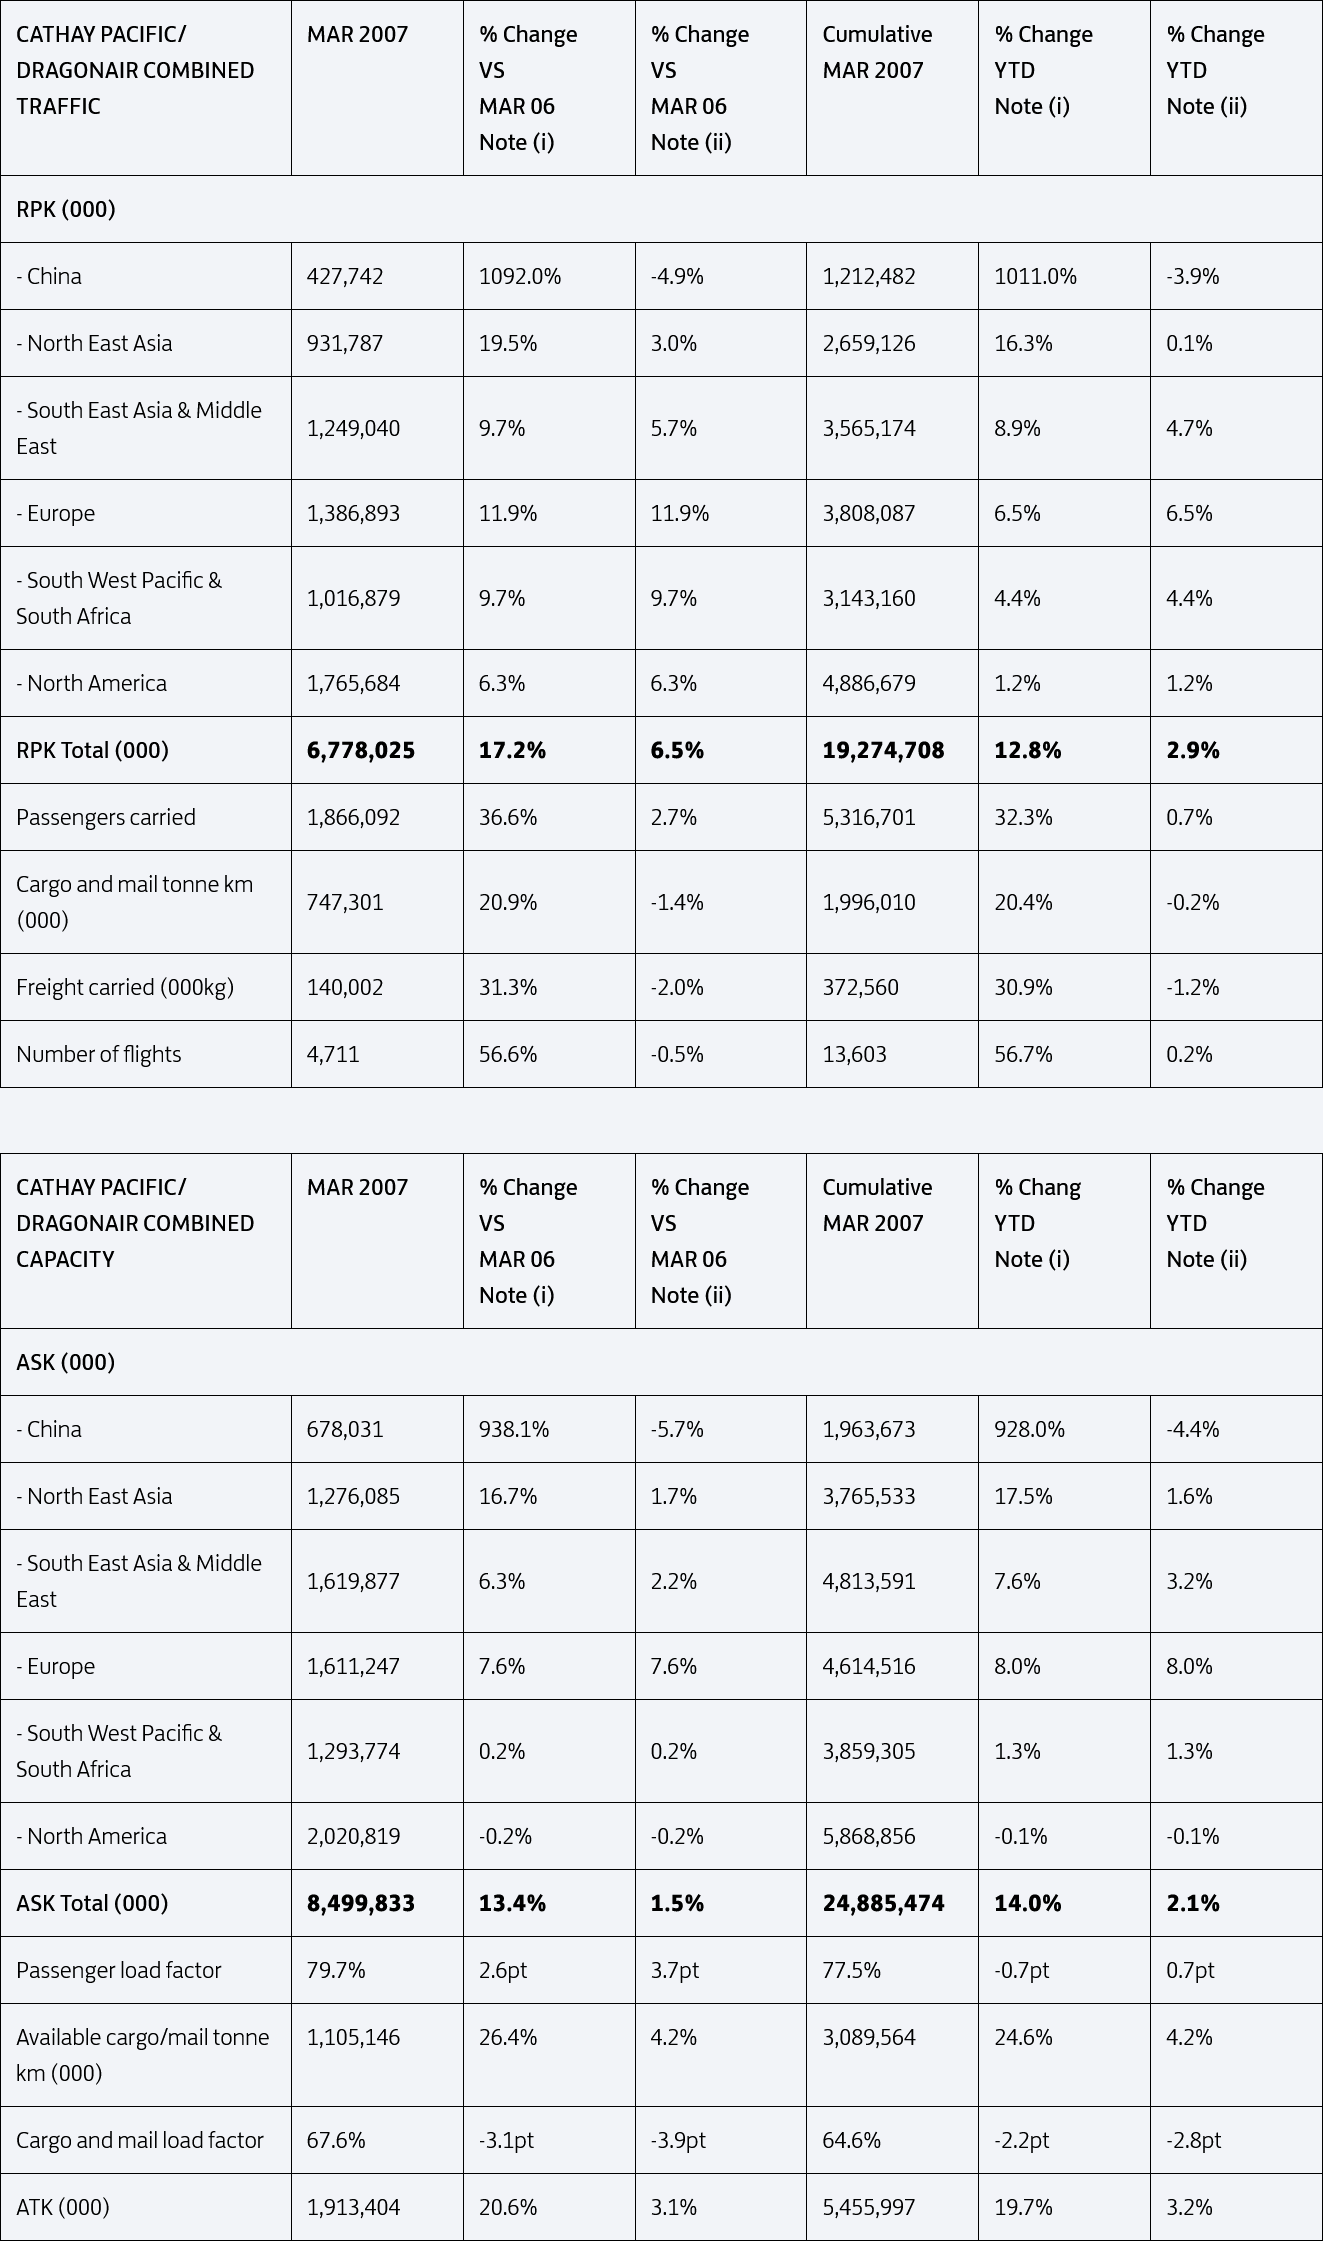
Cathay Pacific Airways today released traffic figures for March 2007 that show the combined Cathay Pacific/Dragonair passenger numbers and load factor rising over the same month in 2006, while the amount of cargo carried slipped back marginally year on year.
The two airlines together carried a total of 1,866,092 passengers in March, marking a rise of 2.7% on the previous year. The load factor for the month was 79.7%, up 3.7 percentage points on 2006, and there was also a climb in capacity - measured in available seat kilometres (ASKs) - of 1.5%. For the year to date, the number of passengers carried is up 0.7% compared to an ASK rise of 2.1%.
The amount of cargo carried by Cathay Pacific and Dragonair in March fell by 2.0% year on year to 140,002 tonnes while the cargo load factor dipped by almost 4 percentage points. Capacity for the two carriers, measured in available cargo and mail tonne kilometres, rose by 4.2% over the same month last year, while capacity for the year to date is up by the same amount.
Cathay Pacific General Manager Revenue Management, Sales & Distribution Ian Shiu said: "March fell between two major public holidays in Hong Kong this year - Chinese New Year and Easter - yet our passenger business held up very well. We are particularly encouraged by the number of front-end travellers, reflecting the positive sentiment in the Hong Kong business community at the moment, and the outlook remains positive through to the summer peak."
Cathay Pacific Director & General Manager Cargo Ron Mathison said: "Weak demand in the cargo market continued through March and for the first quarter we saw a dip in our cargo load factor and tonnage carried. There was no significant pickup following the Chinese New Year holidays and in March we saw a falloff in demand out of our key Hong Kong and Chinese Mainland markets as a result of more cargo moving by ocean instead of air."
The full figures are as below:
Note:(i) Comparative figures excluding Dragonair 2006 traffic / capacity
(ii) Comparative figures including Dragonair 2006 traffic / capacity